
Measuring Data - Understanding Particulate Matter and How It Impacts Our Health
What is Particulate Matter?
Particle pollution, also called particulate matter or PM, consists of solid and liquid particles made up of ash, metals, soot, diesel exhaust, and chemicals. We divide particles into two major groups based on size.
PM10: The coarse particles are between 2.5 and 10 micrometers (from about 25 to 100 times thinner than a human hair). These particles are called PM10 (we say "P M ten", which stands for Particulate Matter up to 10 micrometers in size). These particles cause less severe health effects mostly in the upper respiratory tract. These consist of smoke, dirt and dust from factories, farming and roads as well as mold, spores and pollen. They are made from crushing and grinding rocks and soil then blown by wind.
PM2.5: The small particles are smaller than 2.5 micrometers (more than 100 times thinner than a human hair). These particles are called PM2.5 (we say "P M two point five", as in Particulate Matter up to 2.5 micrometers in size). These consist of toxic organic compounds and heavy metals. They are made from automobile exhaust, burning garbage and landfill, smelting and processing of metals.
Both PM2.5 and PM10 are measured in micrograms per cubic meter.
Which of PM2.5 and PM10 is more harmful?
The smaller particles or PM2.5 are lighter and go deeper into the lungs and cause greater damage longer term. They also stay in the air longer and travel farther. PM10 (big) particles can stay in the air for minutes or hours while PM2.5 (small) particles can stay in the air for days or weeks. And travel? PM10 particles can travel as little as a hundred yards or as much as 30 miles. PM2.5 particles go even farther; many hundreds of miles.
As a result, even though we measure both PM2.5 and PM10, we lay much greater stress on PM2.5 which is the more harmful among the two.
If my monitor says that PM2.5 is 100. What does that mean for my health?
The Indian Government has come up with a definition of health impact for various levels of PM2.5, PM10, and other pollutants such as NO2, CO, SO2, etc. based on significant available health research, as well as what is relevant to Indian conditions in the form of Air Quality Index.
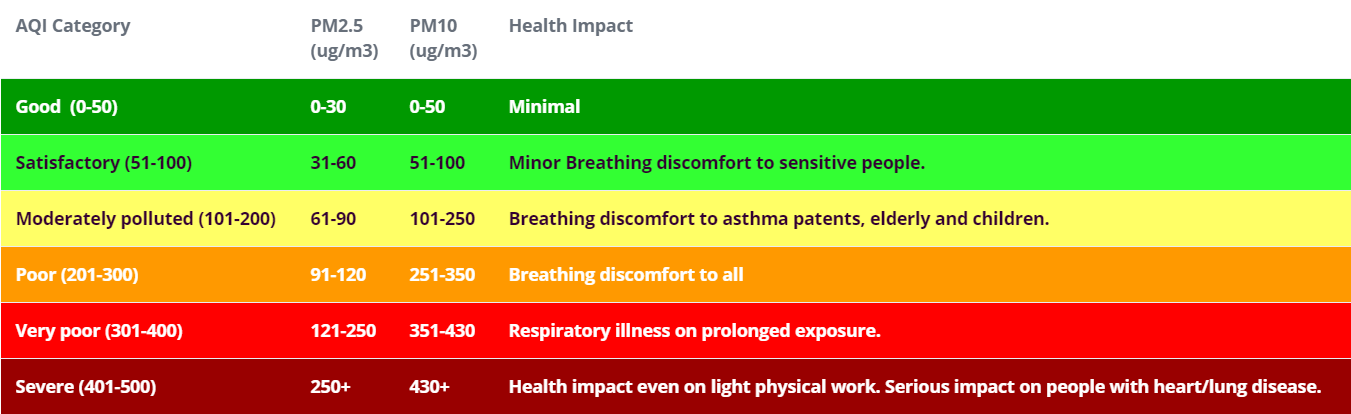
An Air Quality Index or AQI is an overall scheme that transforms values of individual pollutants such as PM2.5, PM10, SO2, CO, etc. into a single number or set of numbers that can then be used to communicate the current levels of air quality and their corresponding health impact consistently across the entire country. The Indian AQI system classifies pollution levels into Good (0-50) to Severe (401-500) categories with health impact varying from minimal to severe.
The breakpoints of different pollutants, for example, (0-30) is Good for PM2.5, (31-60) is Satisfactory, have been defined based on the effect of these pollutants on health. These breakpoints are then mapped to the corresponding AQI ranges of (0-50) for Good and (51-100) for Satisfactory. So a PM2.5 (µg/m³) level of 31 will be represented by a PM2.5 AQI of 51, which corresponds to Satisfactory.
It is important to note whether PM2.5 or PM10 data on online websites is represented as AQI or µg/m³. If the PM2.5 value is 100, then if it is represented as AQI, it will fall in the 'Satisfactory' category, but if it is represented as µg/m³, it will fall under the 'Poor' category.
The table below provides the Indian AQI categories and ranges corresponding to different values of PM2.5 and PM10 and their resulting health impact for your easy reference. Note this will differ if you look at US AQI or Chinese AQI.
Why did Airveda choose to measure Particulate Matter only?
The Government of India has included several pollutants when defining their Air Quality Index. These include CO, Ozone, SO2, NO2, NH3, Pb, PM2.5, and PM10. The current monitoring stations implemented by the government are measuring all these components.
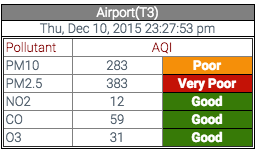
However, by inspecting the air pollution data in Indian cities, it is clear that the pollutants that are most responsible for the poor air quality index in India right now are PM2.5 and PM10, with all other pollutants within good or satisfactory ranges. For example, on the left is a screenshot of air quality data measured at the IGI Airport on Dec 10th 2015, which clearly shows that the PM10 and PM2.5 are the primary causes of poor air quality in Delhi, while other gases like NO2, CO, and O3 are within 'Good' AQI ranges. You can see live data from these stations at SAFAR-India.
"Section 3.5: Interpretation of Air quality using IND-AQI: an example" in the report AQI Report by CPCB (Central Pollution Control Board) shares the same conclusion based on data in various cities in India.
In addition, there has been significant research around the effects of PM2.5 and PM10 worldwide which has connected high levels of exposure to these pollutants with significant health problems, including: premature mortality, chronic respiratory disease, emergency visits and hospital admissions, aggravated asthma, acute respiratory symptoms, and decrease in lung function. As a result, almost all countries have stringent regulations around maintaining safe levels of PM2.5 and PM10.
Hence, it made sense for us to focus on building a monitor that helps you manage the PM2.5 and PM10 levels in the air you breathe rather than focus on all other pollutants, which would increase the cost of the monitor and make it more complex to understand.

About the author
Airveda team is a group of people helping everyone breathe well and live well.