Gurgaon's Air Quality Trends (2020–2025): A Data-Driven Reality Check
Disclaimer
The air quality data presented in this blog is derived from publicly available government sources and independently deployed sensors by Airveda throughout Gurgaon. This analysis aims to offer insights into air quality trends and their potential health impacts. The figures mentioned should not be interpreted as regulatory values or cited as official data for legal or compliance purposes.
Introduction: The Air We Breathe
It was a chilly January morning in Gurgaon when Meera, a mother of two, stepped outside to drop her kids at school. The sun barely cut through the thick, grey smog that cloaked the skyline. Her youngest, Aryan, tugged at her sleeve and asked, “Mumma, why does the sky look so dirty?” That moment, simple yet powerful, captures the unsettling truth faced by millions across Gurgaon every single day.
This blog continues our earlier deep dive on Go through the Gurgaon Pollution Trends, extending the analysis to 2025. Air pollution in Gurgaon isn’t just a scientific metric or a government report—it’s a lived reality that affects how we work, play, raise our children, and even breathe.
While most people associate severe pollution with the winter months, the reality is far more concerning. According to U.S. air quality standards, pollution in Gurgaon remains unhealthy across all seasons. The misconception that air pollution is only a cold-weather concern distracts from the year-round impact on human health, especially for vulnerable groups like children, the elderly, and individuals with respiratory or cardiovascular conditions.
At Airveda, we aim to empower individuals and organizations with real-time data and actionable insights. In this in-depth report, we analyze five years of air quality data in Gurgaon to unravel trends, bust myths, and provide clear, actionable steps for individuals and businesses to protect themselves and their communities.
1. Five-Year Pollution Overview (2020–2025)
| Year | PM2.5 Level | PM10 Level | Overall AQI Category |
|---|---|---|---|
| 2020 | Poor | Moderate | Moderate |
| 2021 | Poor | Moderate | Poor |
| 2022 | Moderate | Moderate | Moderate |
| 2023 | Poor | Moderate | Poor |
| 2024 | Poor | Moderate | Poor |
The table above reveals a worrying trend. While 2022 showed a temporary improvement in both PM2.5 and PM10 levels, the subsequent years saw a significant deterioration. Both 2023 and 2024 fell squarely in the "Very Poor" category, emphasizing that the measures currently in place are not producing long-term gains.
2. Seasonal Comparison (2020–2025)
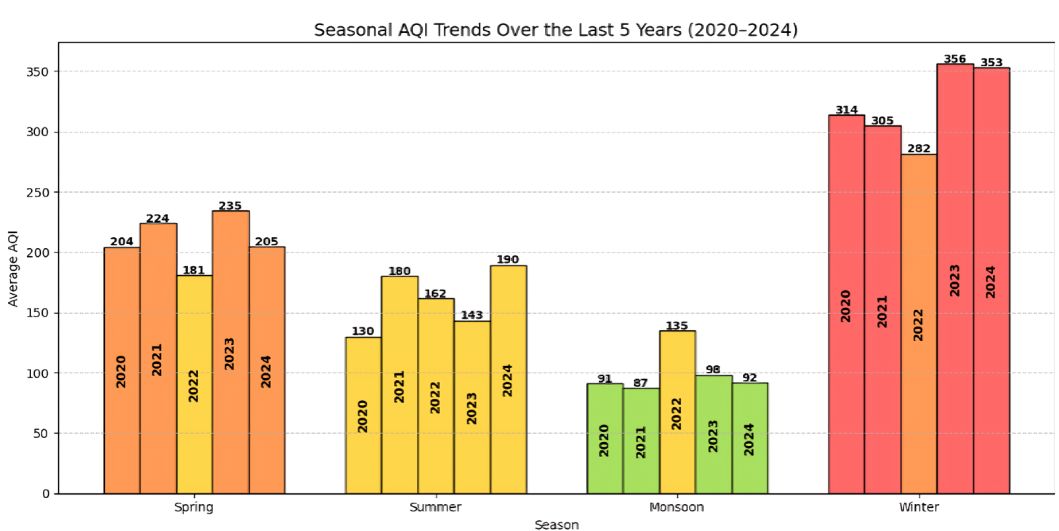
The seasonal breakdown reveals telling trends in air quality over the past five years. As expected, winter months continue to show the most hazardous pollution levels, driven by meteorological inversion, increased biomass burning, and emissions from Diwali festivities.
However, what’s increasingly alarming is the deterioration of air quality during traditionally cleaner seasons. Both spring and summer, once perceived as relatively safer periods, have consistently registered ‘Poor’ or ‘Moderate’ air quality, indicating that unhealthy air is now a year-round concern. Only the monsoon season still offers some relief, largely due to rainfall and better atmospheric dispersion.
Yet, even these categorizations may understate the actual threat.
Reframing the Reality: Indian vs. US AQI Standards
This side-by-side seasonal comparison starkly illustrates how different frameworks interpret the same data and how these differences shape public perception.
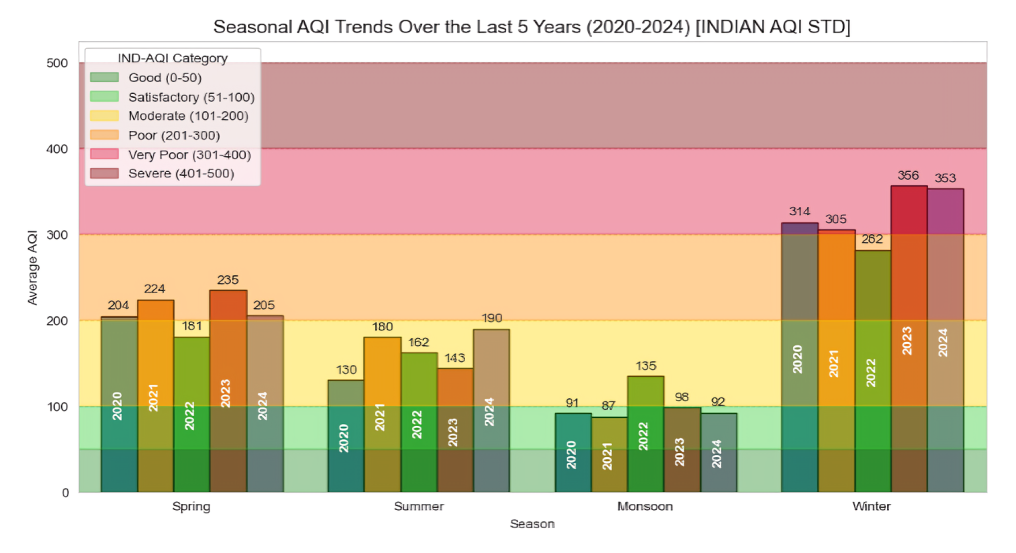
Seasonal AQI trends of Gurugram over the last 5 years according to Indian AQI Standards
| Season | 2020 | 2021 | 2022 | 2023 | 2024 |
|---|---|---|---|---|---|
| Spring | Poor | Poor | Moderate | Poor | Poor |
| Summer | Moderate | Moderate | Moderate | Moderate | Moderate |
| Monsoon | Satisfactory | Satisfactory | Moderate | Satisfactory | Satisfactory |
| Winter | Very Poor | Very Poor | Poor | Very Poor | Very Poor |
Under Indian AQI standards, Gurugram appears to experience periodic relief, especially during the monsoon and summer months, with several seasons classified as “Moderate” or even “Satisfactory.” At a glance, this might reassure residents that conditions are improving or manageable.
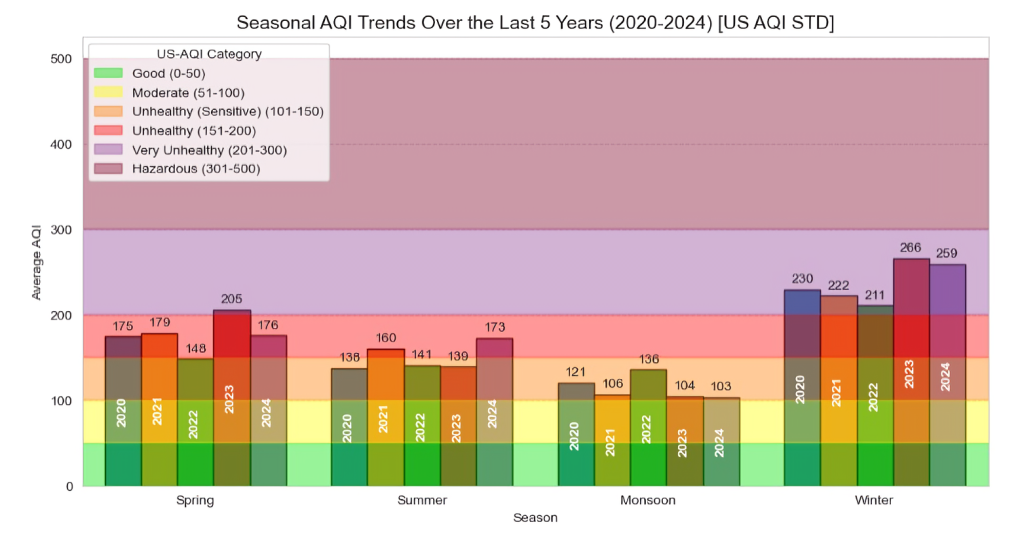
Seasonal AQI trends of Gurugram over the last 5 years according to US AQI Standards
| Season | 2020 | 2021 | 2022 | 2023 | 2024 |
|---|---|---|---|---|---|
| Spring | Unhealthy | Unhealthy | Unhealthy for Sensitive Groups | Very Unhealthy | Unhealthy |
| Summer | Unhealthy for Sensitive Groups | Unhealthy | Unhealthy for Sensitive Groups | Unhealthy for Sensitive Groups | Unhealthy |
| Monsoon | Unhealthy for Sensitive Groups | Unhealthy for Sensitive Groups | Unhealthy for Sensitive Groups | Unhealthy for Sensitive Groups | Unhealthy for Sensitive Groups |
| Winter | Very Unhealthy | Very Unhealthy | Very Unhealthy | Very Unhealthy | Very Unhealthy |
However, the picture changes dramatically when the same air quality is evaluated using US AQI standards. Even the monsoon and summer months, once seen as clean, are consistently rated “Unhealthy for Sensitive Groups” or worse. The winter season, already labeled “Very Poor” in India, reaches “Very Unhealthy” levels under the US system, reflecting the true scale of the crisis.
This discrepancy is rooted in the more stringent thresholds used by the US EPA. For example, PM2.5 concentrations that qualify as “Moderate” in India are already considered “Unhealthy” in the US
3. Severe AQI Days (AQI > 400)
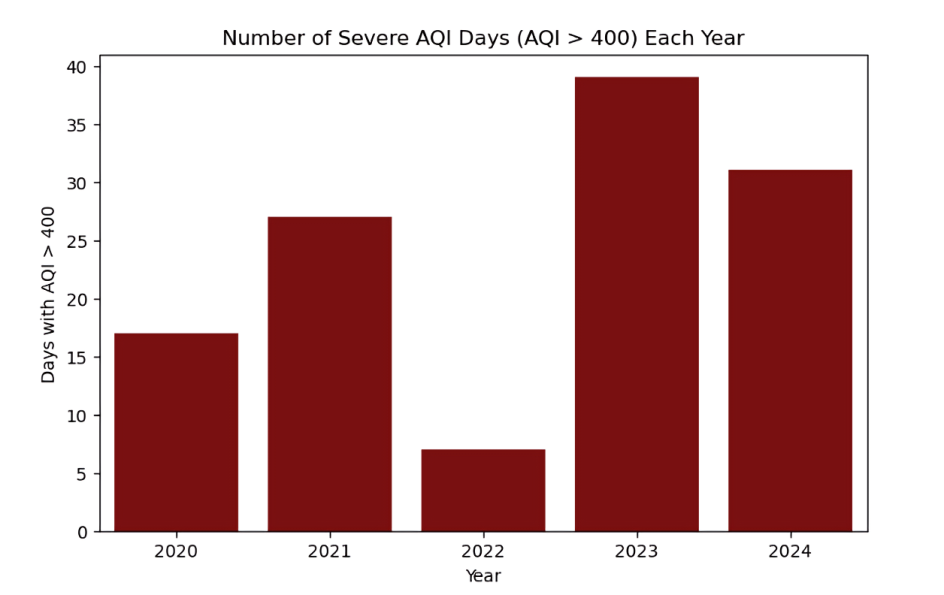
| Year | Number of Severe AQI Days |
|---|---|
| 2020 | 17 |
| 2021 | 27 |
| 2022 | 7 |
| 2023 | 39 |
| 2024 | 31 |
The rise in the number of severe AQI days is a critical public health indicator. The year 2023 saw the highest number of days when the AQI crossed the 400 mark, making the air hazardous even for healthy individuals. These are not just numbers; they translate into hospital visits, missed school days, and long-term respiratory damage for thousands of residents, especially vulnerable people.
Confused about AQI categories and what they mean for your health? Check out AQI calculator
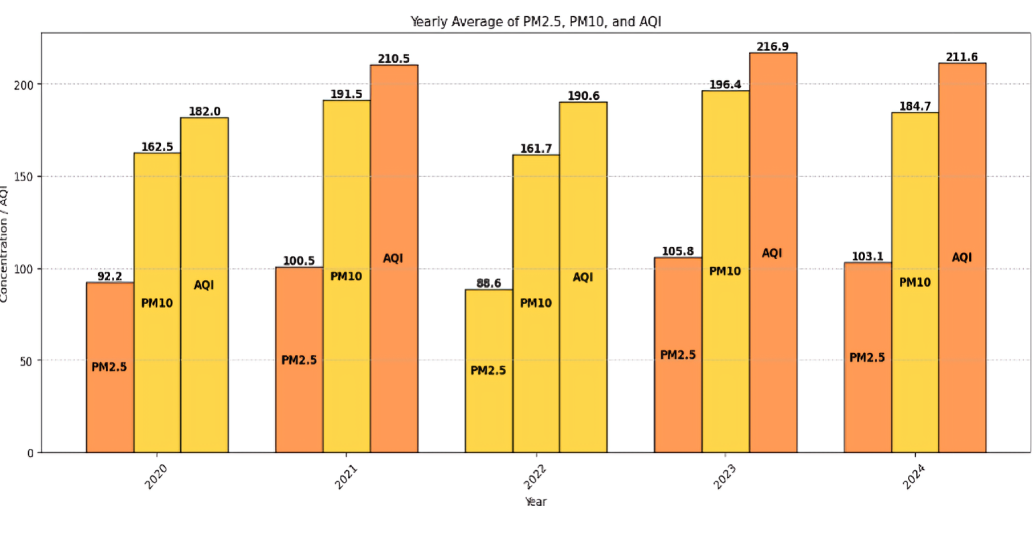
4. Five-Year PM2.5 Trend
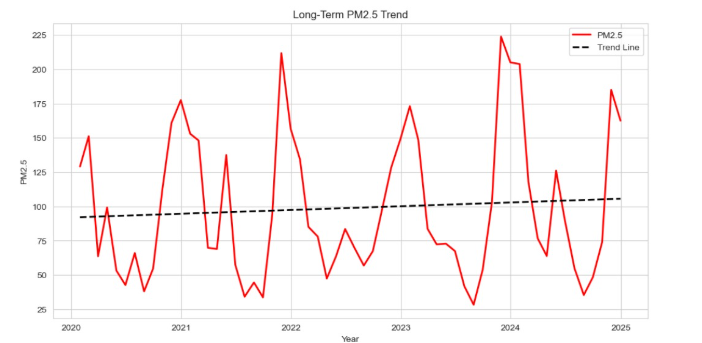
- Average PM2.5 (2020–2024):103 µg/m3
-
WHO Guidelines:
- The annual average should not exceed 5 µg/m3
- The 24‑hour average should not exceed 15 µg/m3 for more than 3–4 days/year
When compared to WHO guidelines, Gurgaon's PM2.5 levels are more than 20 times the safe limit. This continuous exposure to elevated PM2.5 levels can lead to chronic health conditions such as asthma, lung cancer, and heart disease. What is especially alarming is that children exposed to such conditions may experience stunted lung development.
5. Why Businesses & Institutions Must Pay Attention
Air quality isn’t just a personal health issue; it’s a strategic business concern.
- Employee Health & Productivity: Employees exposed to poor air are more likely to suffer from respiratory illnesses, resulting in increased absenteeism and reduced productivity.
- Corporate Responsibility: As ESG (Environmental, Social, and Governance) factors become critical in investment and partnership decisions, companies demonstrating a proactive stance on air quality stand to gain a competitive advantage.
- Data-Driven Decision Making: Airveda provides customized monitoring solutions and analytics dashboards that allow businesses to optimize ventilation systems, plan operations more effectively, and maintain compliance with internal and external air quality benchmarks.
6. What You Can Do
For Individuals:
- Regularly check AQI levels via the Airveda app or website
- Limit outdoor activities during high‑pollution hours
- Use air purifiers at home and in workplaces
- Wear certified N95 masks when outdoors
For Businesses & Institutions:
- Deploy indoor and outdoor air quality monitors
- Retrofit HVAC systems with HEPA filters
- Use air quality data to align work schedules, outdoor events, and maintenance tasks
- Raise awareness among employees and residents
Conclusion: It’s Time to Act
The evidence is undeniable: air pollution in Gurgaon is not a seasonal problem—it’s a constant, silent threat that spans the entire year. The consequences of inaction are far-reaching, impacting not only the economy but also our health, productivity, and overall quality of life.
This is not just a wake-up call, it’s a demand for sustained, informed action.
At Airveda, we believe that awareness backed by data is the first step toward change. Our advanced, real-time air quality monitoring tools empower individuals, communities, businesses, and governments to take meaningful, data-driven steps toward cleaner air. Because clean air is not a privilege it’s a fundamental right.
Take Control of the Air You Breathe
- Monitor air quality in Real-Time
- Understand Your Exposure
- Drive Impact in Your Community
Go through the Airveda Product Catalog - Explore Innovative Air Monitoring Solutions and discover our innovative air monitoring solutions—designed for homes, schools, offices, industries, and public spaces.
Make the invisible visible. Be part of the clean air movement.
About the author
Airveda team is a group of individuals working tirelessly with a mission to help people breathe well and live well.